Visual overview
A slide-by-slide walkthrough of the HerdLink idea — the problem, the two core concepts, the method, and the results. For the rigorous numbers and their caveats, see the detection method and the white paper; a few panels below are deliberately schematic (illustrative curves, not plotted data) and are marked as such.
The pitch. Reading the herd's social network to catch illness earlier — a software layer on top of the collars already in the paddock.
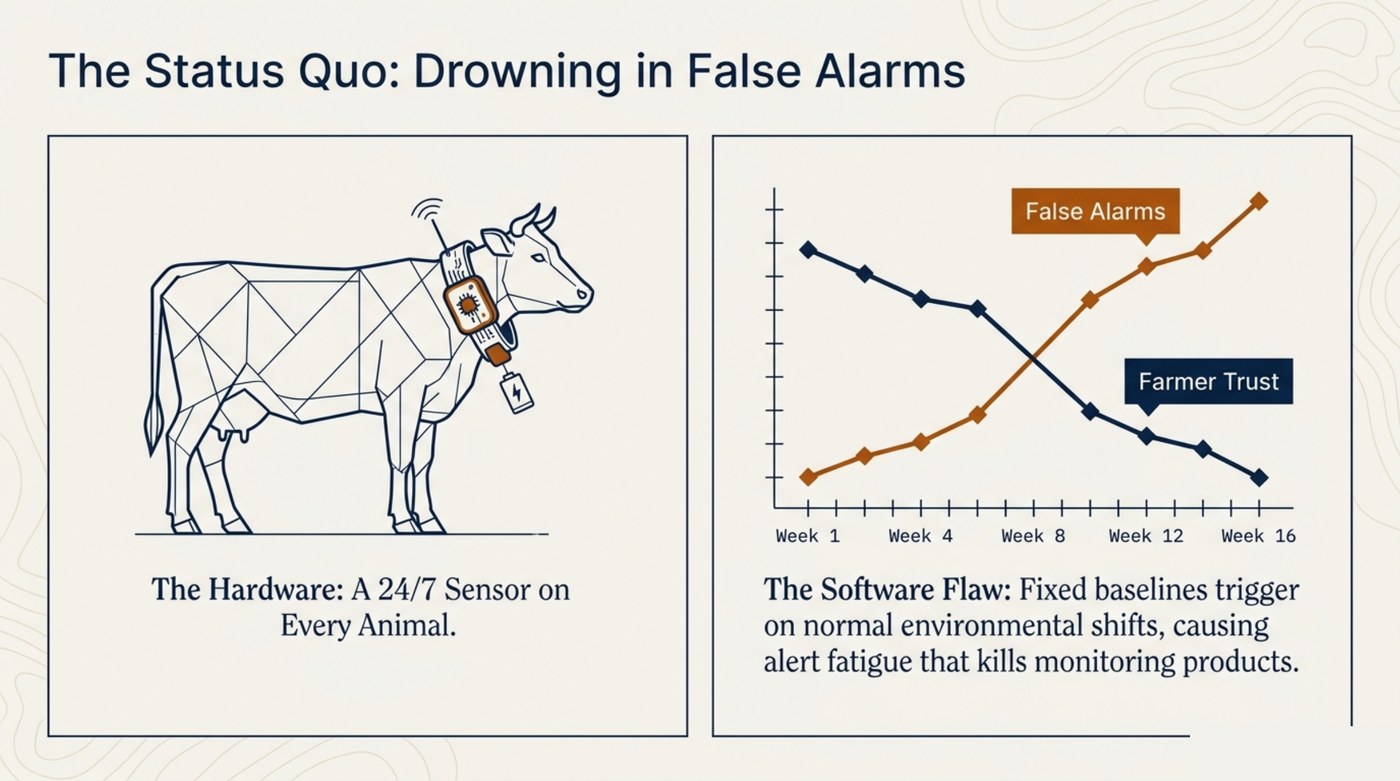
The status quo. The hardware already puts a sensor on every animal. The software flaw is fixed per-animal baselines: they fire on normal environmental shifts, and the resulting alert fatigue is what kills monitoring products. (The trust/alarm curves are illustrative.)
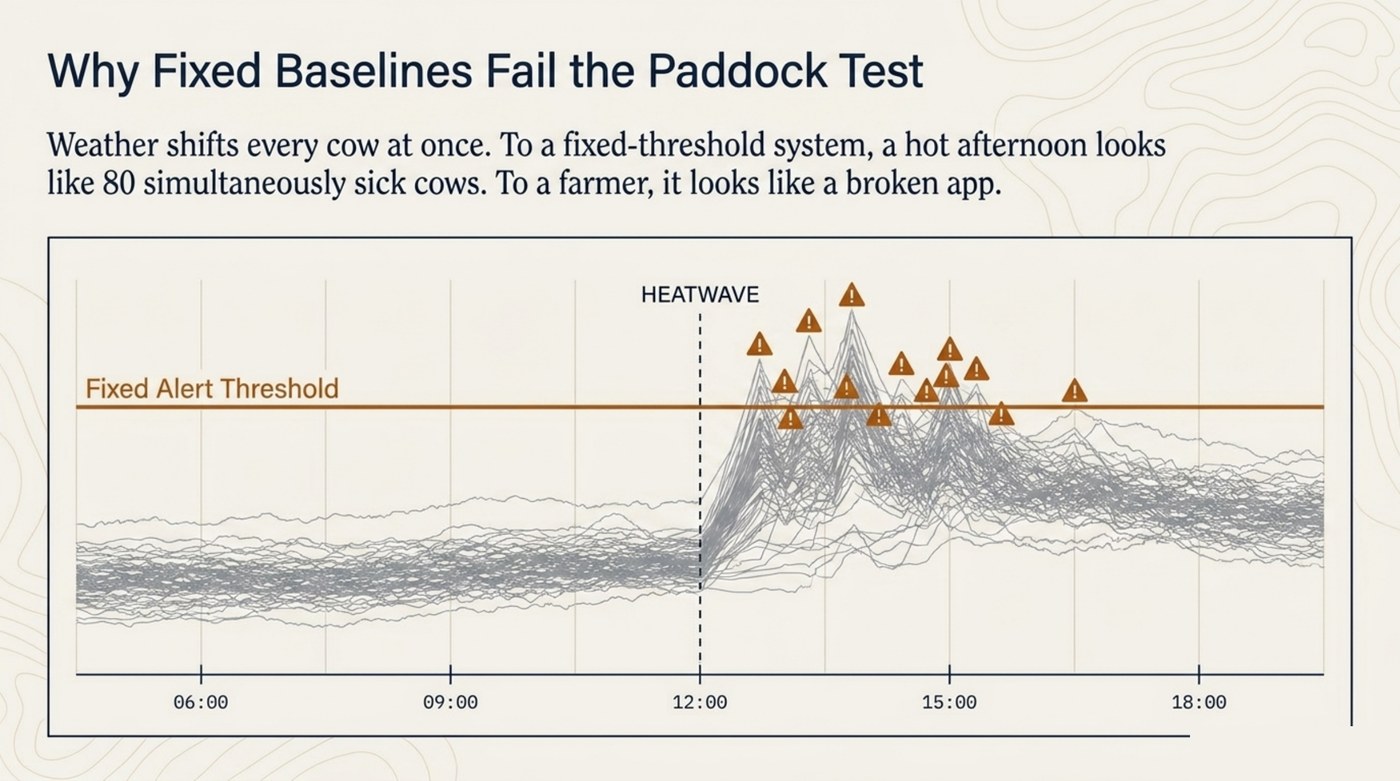
Why fixed baselines fail the paddock test. Weather moves every cow at once. To a fixed-threshold system a hot afternoon looks like 80 simultaneously sick cows; to a farmer it looks like a broken app. (Schematic.)
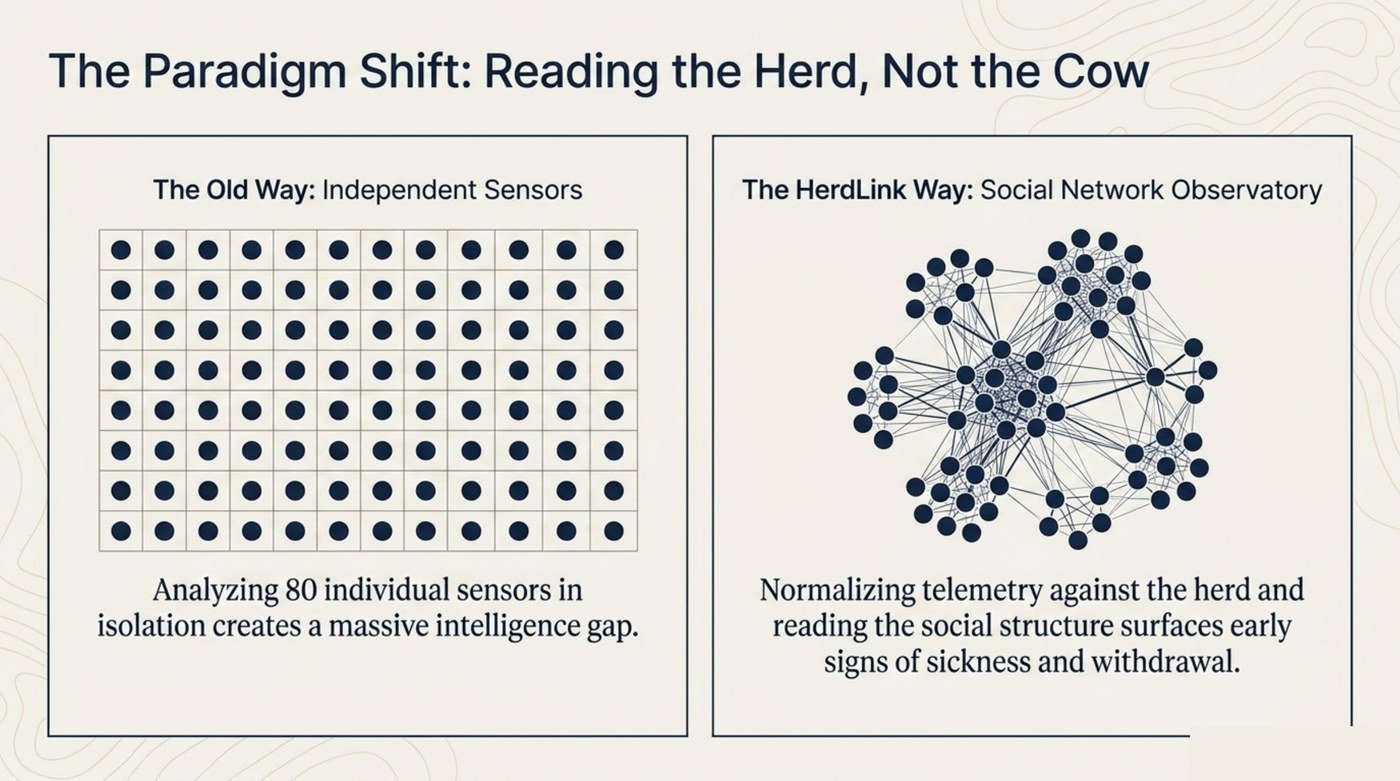
The paradigm shift. Stop analysing 80 sensors in isolation. Normalise each animal against the herd, and read the herd's social structure — that is where early sickness and withdrawal surface.
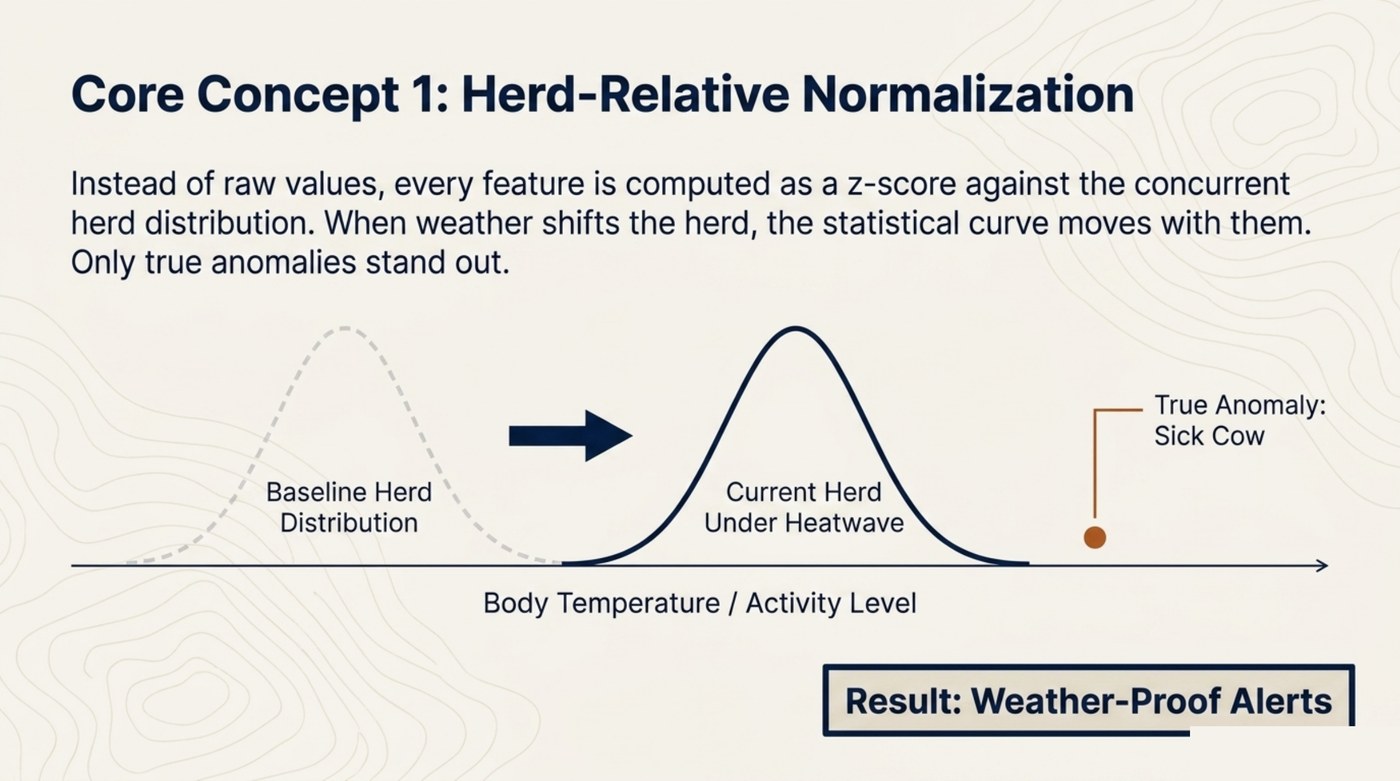
Core concept 1 — herd-relative normalization. Every feature is a z-score against the concurrent herd distribution. When weather shifts the herd, the curve shifts with it and only true anomalies stand out. The result is weather-proof alerts.
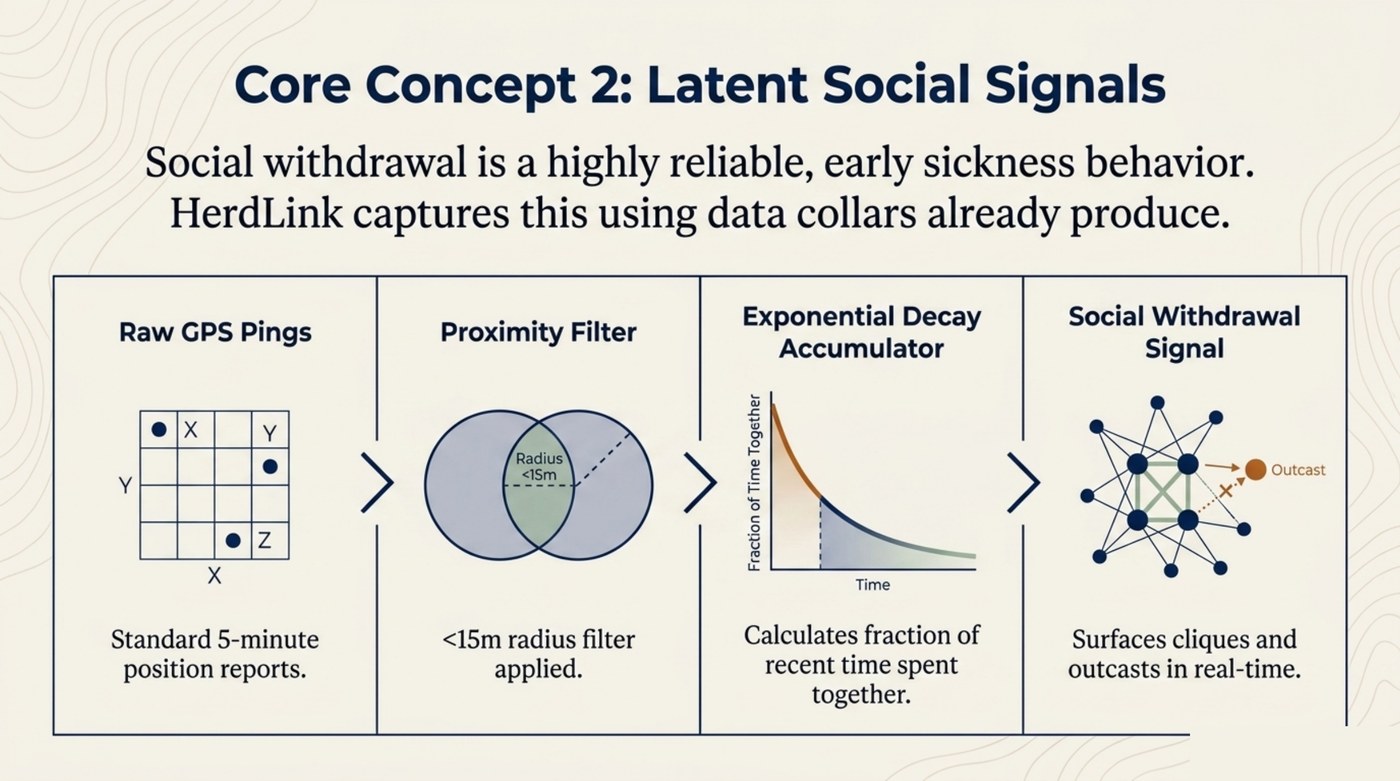
Core concept 2 — latent social signals. Social withdrawal is an early sickness behaviour, latent in data collars already produce: raw GPS pings → a 15 m proximity filter → an exponential-decay accumulator (fraction of recent time spent together) → cliques and outcasts in real time.
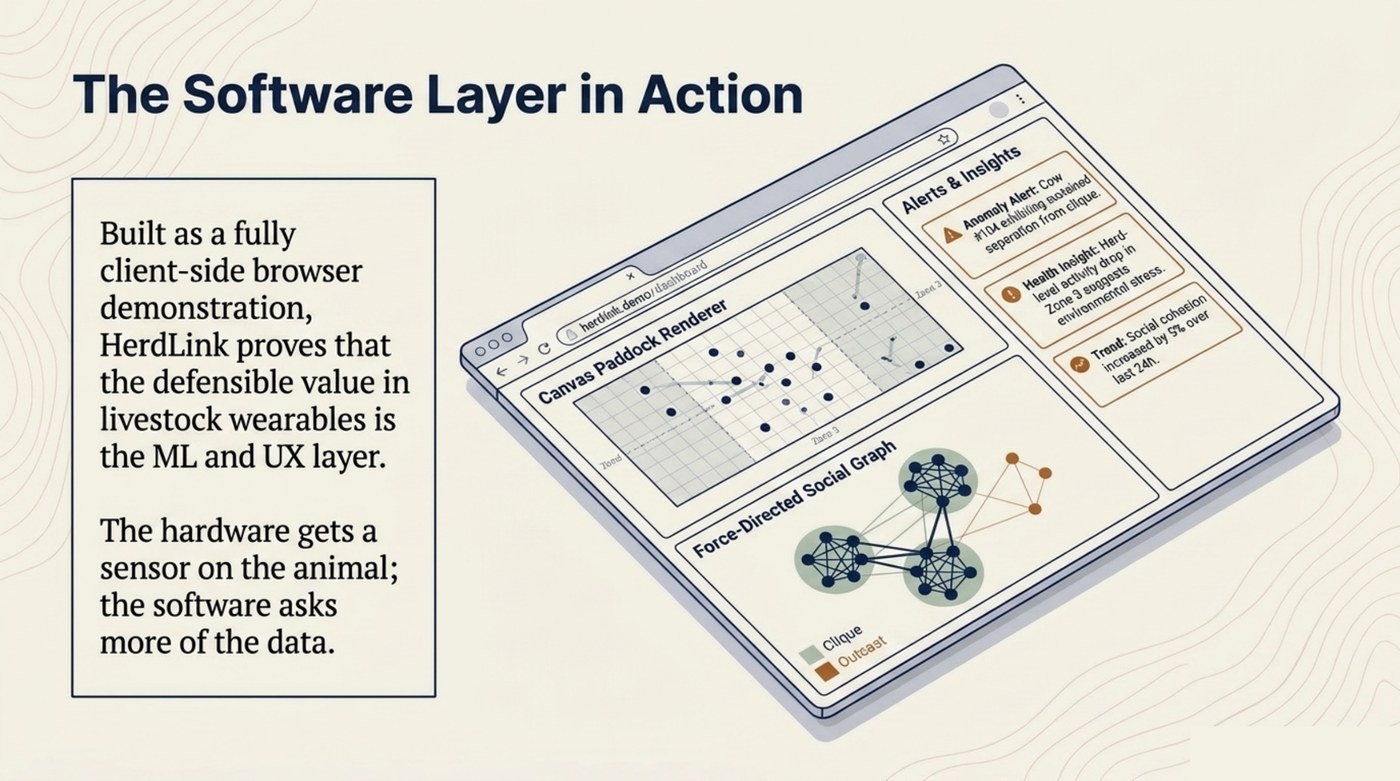
The software layer in action. A fully client-side browser demo — canvas paddock renderer, force-directed social graph, and an alerts-and-insights feed. The hardware gets a sensor on the animal; the software asks more of the data.
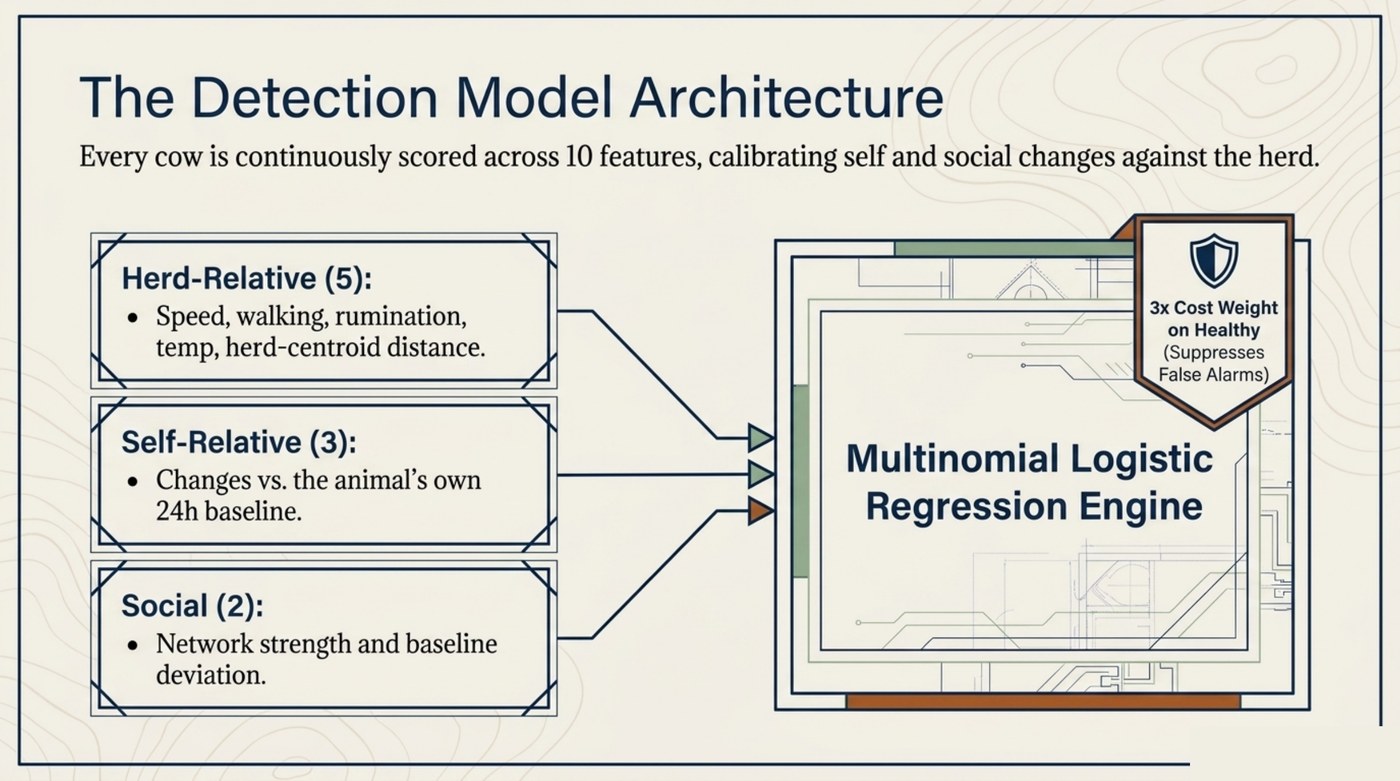
The detection model. Each cow is continuously scored across 10 features — herd-relative (5), self-relative (3), and social (2) — by a multinomial logistic regression, with a 3× cost weight on healthy examples to suppress false alarms.
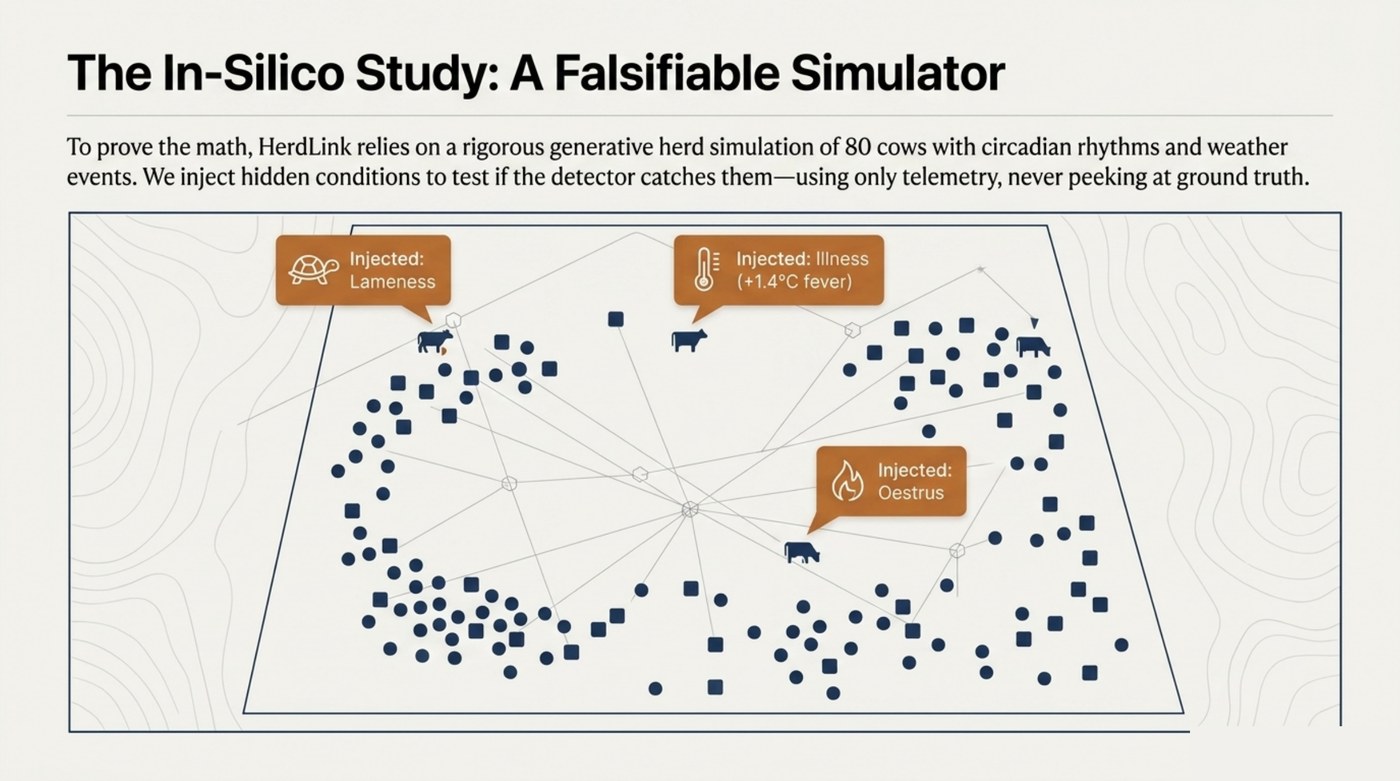
The in-silico study. A generative herd of 80 cows with circadian rhythms and weather. Hidden conditions (lameness, illness, oestrus) are injected and the detector must catch them from telemetry alone, never peeking at ground truth.
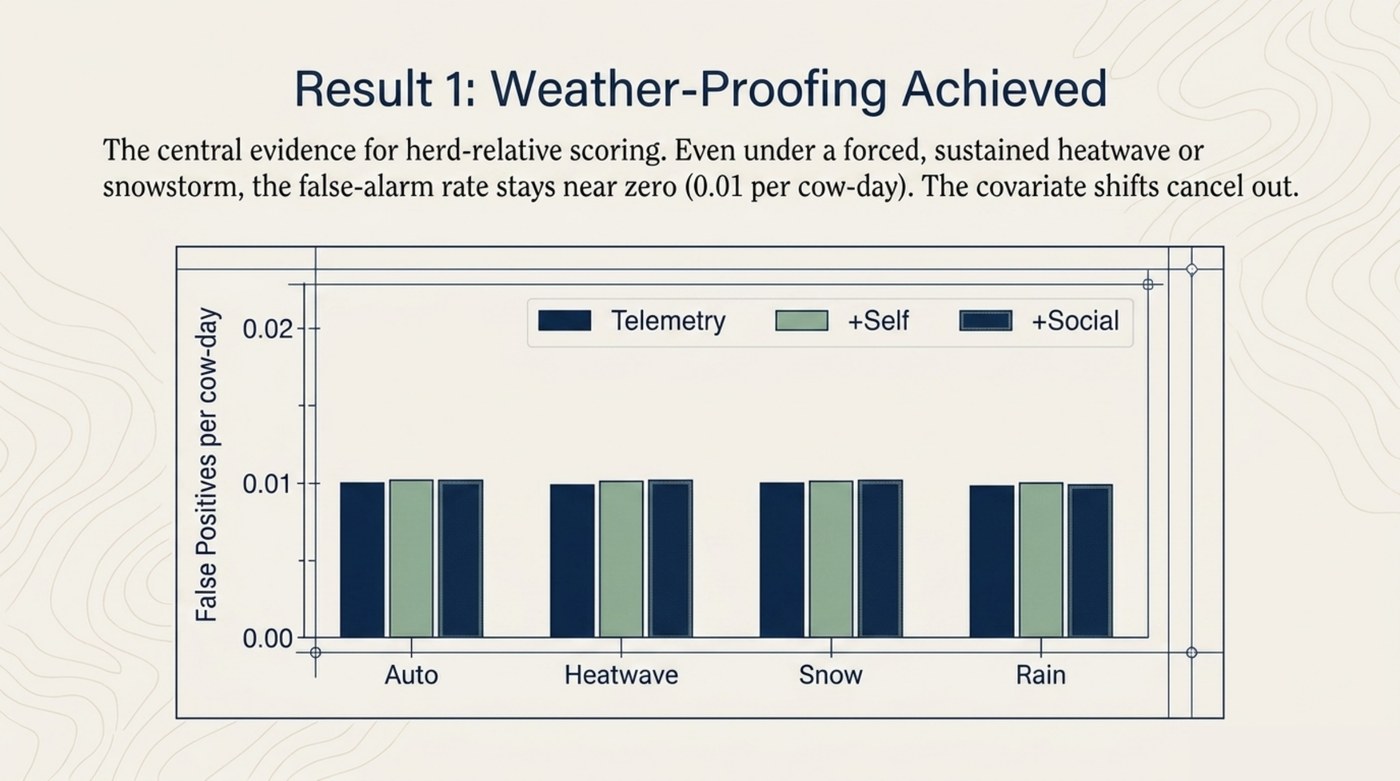
Result 1 — weather-proofing achieved. The central evidence for herd-relative scoring: even under a forced, sustained heatwave or snowstorm the false-alarm rate stays near 0.01 per cow-day. The covariate shifts cancel out.
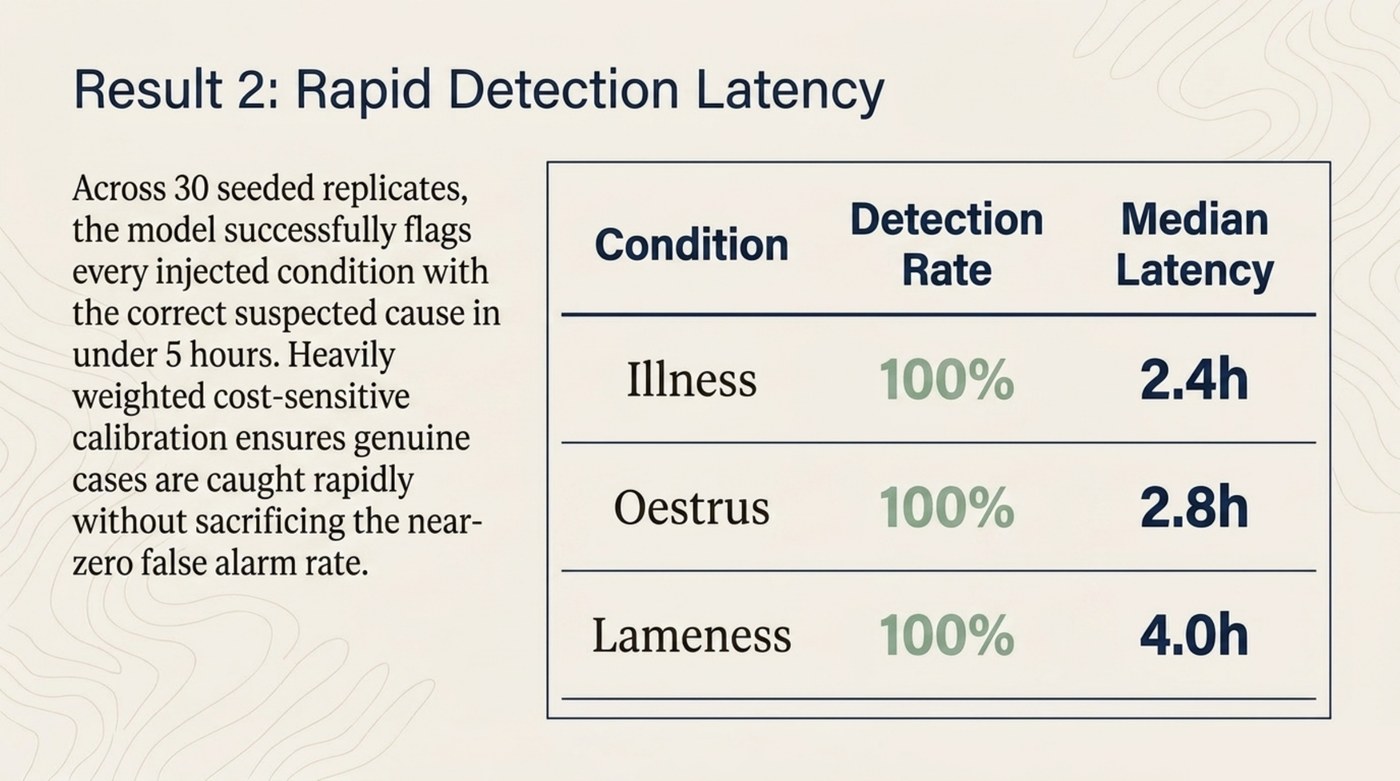
Result 2 — rapid detection. Across 30 seeded replicates every injected condition is flagged with the correct suspected cause: illness in 2.4 h, oestrus 2.8 h, lameness 4.0 h — all at 100% detection, without sacrificing the near-zero false-alarm rate.
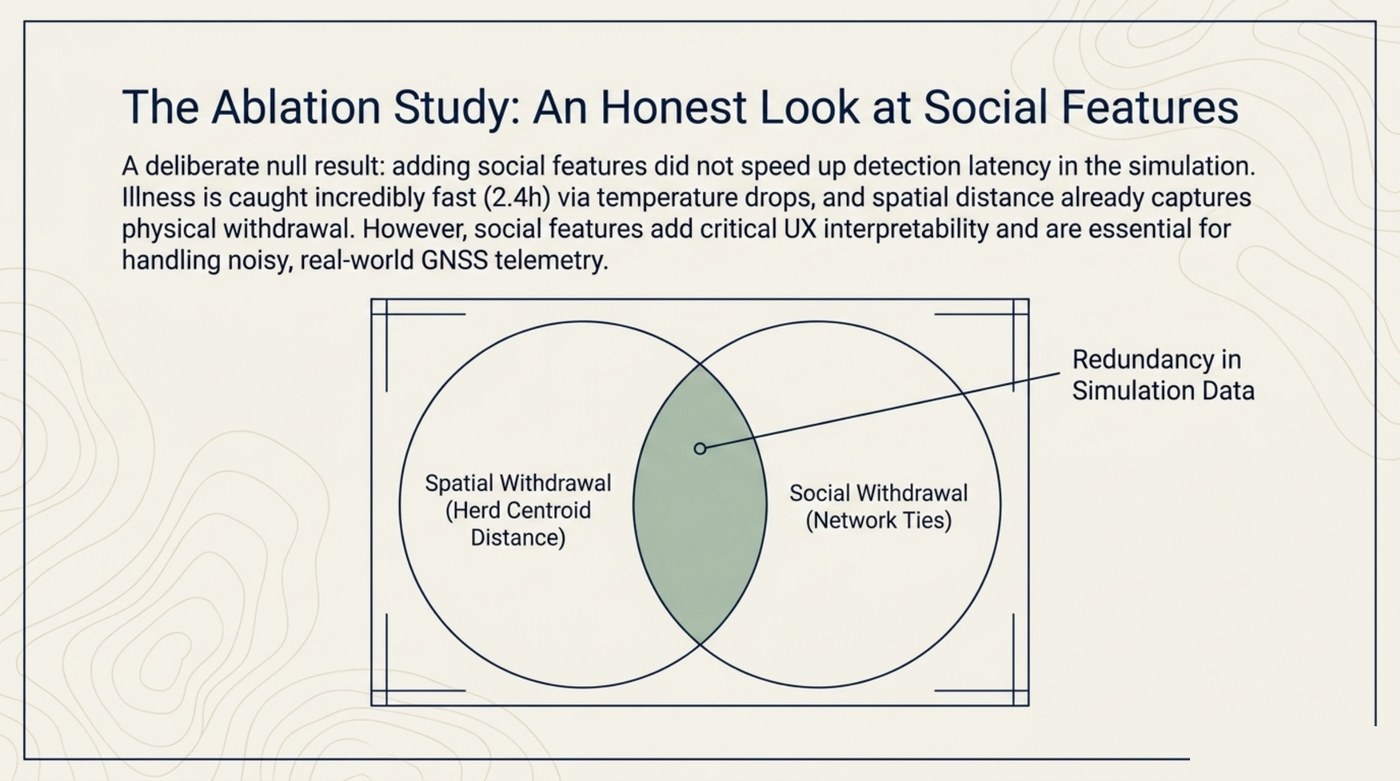
The ablation — an honest look. A deliberately reported null result: adding social features did not speed up detection in the simulation, because spatial distance already captures physical withdrawal. Their value here is UX interpretability, and they are expected to matter for noisy real-world GNSS.
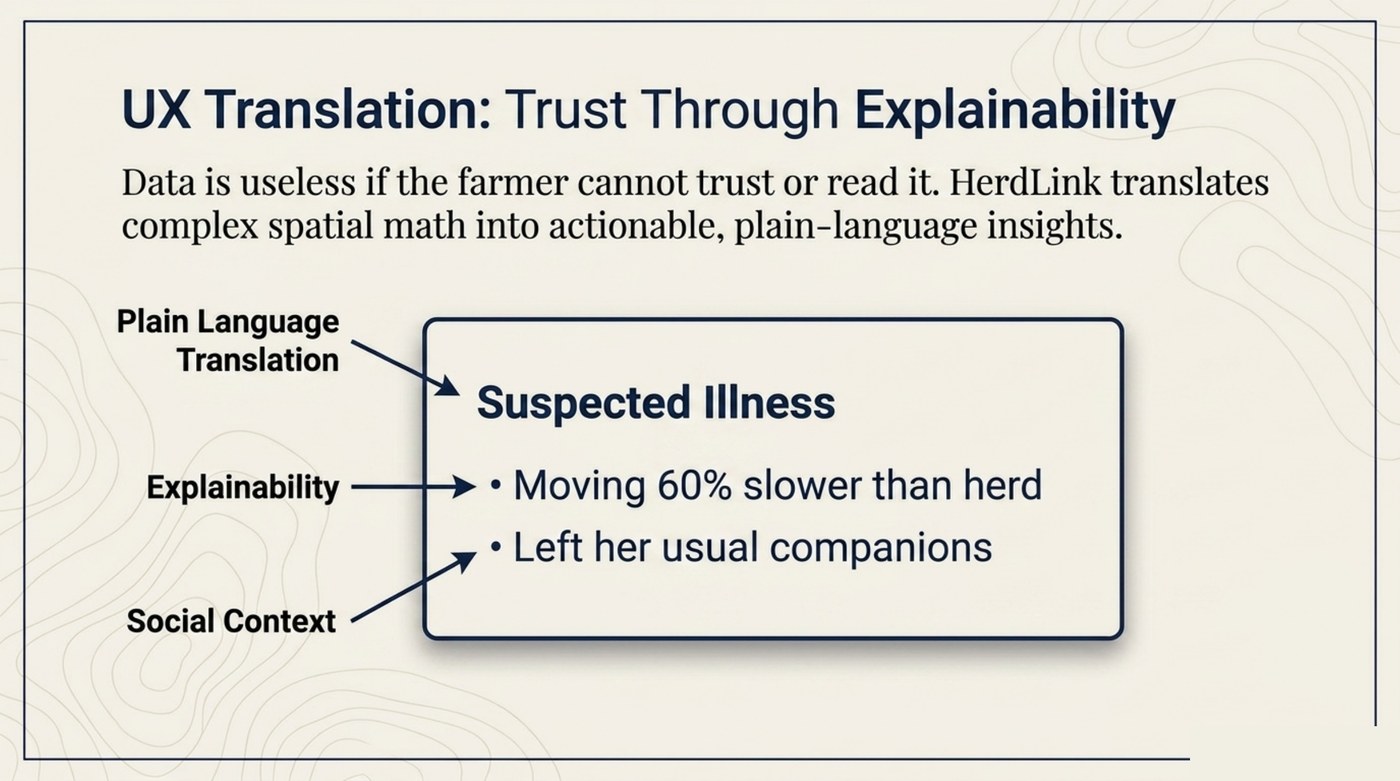
UX translation — trust through explainability. Data is useless if the farmer can't read or trust it. Every alert translates the spatial maths into plain language: "moving 60% slower than herd; left her usual companions."
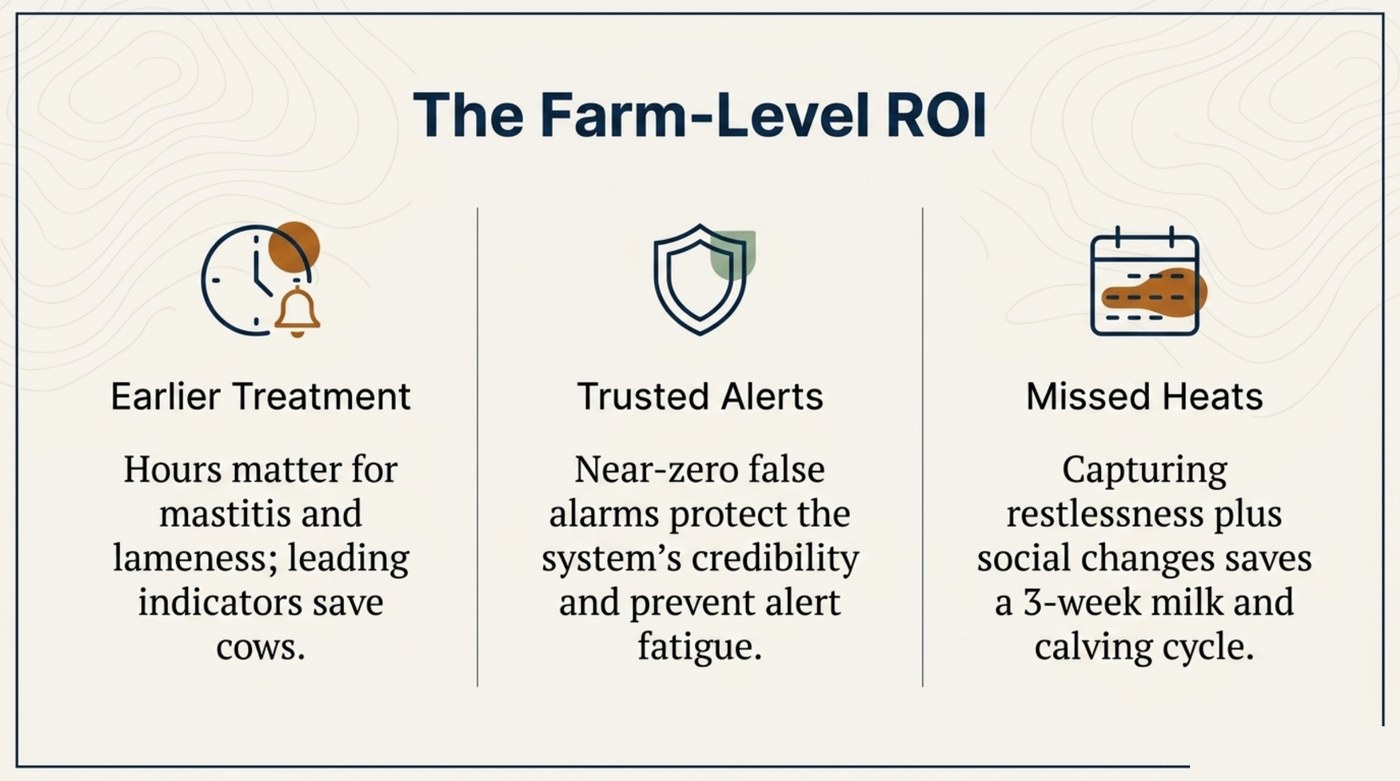
The farm-level ROI. Earlier treatment (hours matter for mastitis and lameness), trusted alerts (near-zero false alarms protect credibility), and fewer missed heats (each missed heat costs a three-week cycle).
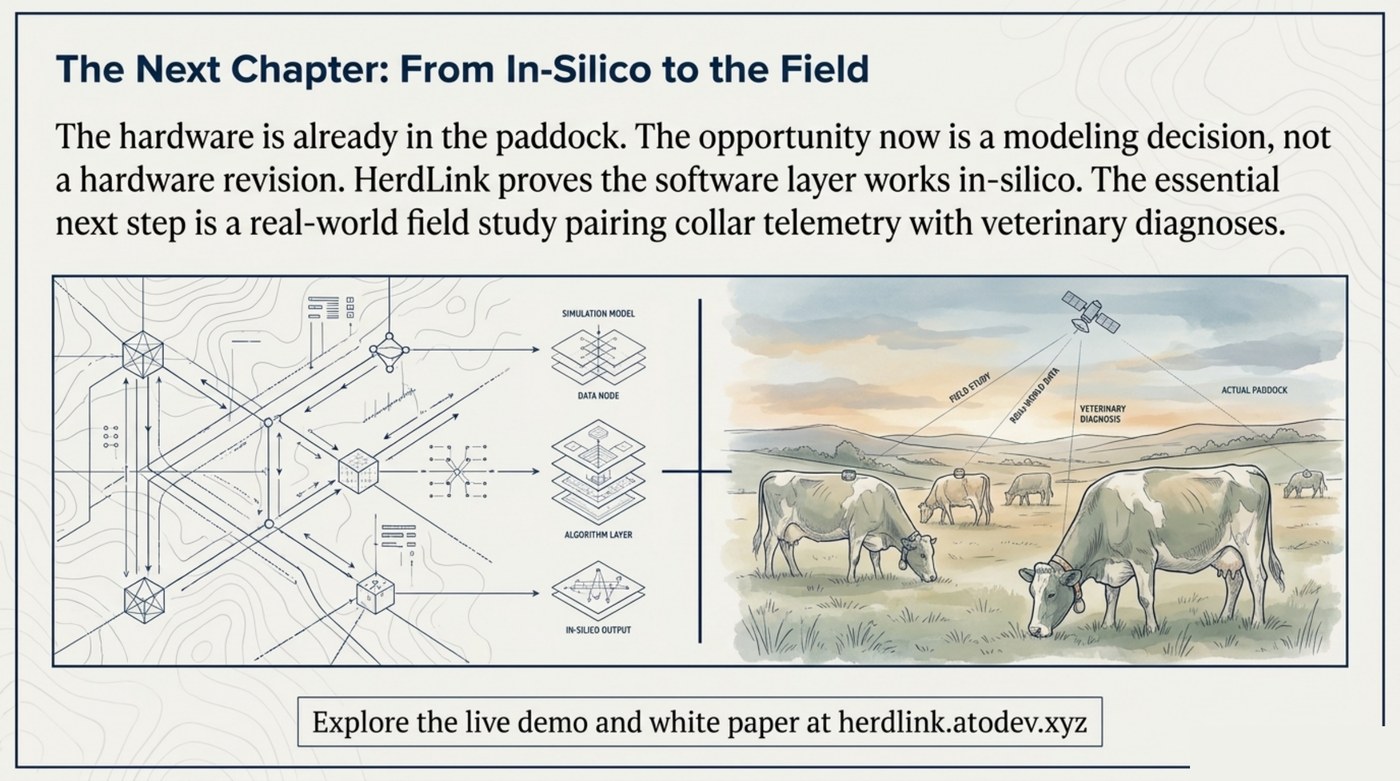
The next chapter. The method works in-silico. The opportunity is a modelling decision, not a hardware revision — and the essential next step is a real-world field study pairing collar telemetry with veterinary diagnoses.